QGIS: A getting started tutorial on a free Geographic Information System
I needed a map. Actually, a pretty simple – I thought – map. I had some county-level data for my state and I wanted a GIS that:
- color-filled each county for its particular data value
- created output easily printed on standard letter-sized paper
- produced a professional looking map
- didn’t require a Ph.D. in Geographical Information Systems
- didn’t require a second mortgage to acquire
Enter stage right: QGIS: A Free and Open Source Geographic Information System.
QGIS is a powerful mapping system that is both open source and community supported. If you are, like me, a neophyte to GIS, it is well worthwhile to spend some time on the QGIS website looking at their documentation and different levels of support. An Internet search on QGIS will also result in many hits and other sources of support.
Consider yourself warned
What follows is the first of several tutorials of how I got QGIS to produce the map I needed. I need such maps only two or three times a year, so this tutorial avoids recreating that nasty wheel in several months time.
However, I am not a GIS expert by any means. There are, undoubtedly, more elegant ways to accomplish the task documented here besides my duct tape and bailing wire approach.
If you follow the steps in this, and subsequent, tutorials I strongly recommend you proof your work! It is very easy to totally corrupt data while presenting a perfectly normal looking map. The result of such an error is a map that might present the exact opposite of what the data really says.
First step: find and install the QGIS software
The QGIS Standalone Installer is available free at the QGIS website by clicking on the Download Now button. I grabbed the 64bit, v2.0.1 for Windows 7. The software installed like any other Windows program.
The download and subsequent install did require patience. It is a large file, on the order of 180+ megs, and takes awhile to download as well as install.
The QGIS install offers the opportunity to download several example data sets. Normally, I go ahead and grab things like this when I’m learning a new system. However, the files are very large, so I skipped this step.
As with all things in life, Your Mileage May Vary.
Shapefiles: the backbone of our GIS map
Remember those counties I wanted to color code? For that, I needed ESRI shapefiles.
There are many sources of shapefiles. The United States Census Bureau provides TigerLine Shapefiles as well as many other GIS data products. For this project, I used the 2013 TigerLine Shapefiles via their ftp site.
The Census Bureau also provides a web-driven download site. In this particular example, Counties (and equivalent) provides the same county shapefiles for the entire US as the FTP site.
Tip: Even more sources of shapefiles
Many state governments now maintain their own GIS programs and offer free data, including shapefiles, on their websites. For example, an Internet search for Vermont shapefiles resulted in a hit on Vermont Center for Geographic Information. A bit of nosing around on the website, and I wound up on their Geospatial and imagery page with all sorts of goodies. The county shapefiles were under the Boundaries (Admin-Political) theme.
I’ve found similar pages for other states as well. Many of these sites have already done some of the heavy lifting of database management by incorporating such things as census data and the like in the shapefiles.
In this tutorial, I stuck with the TigerLine shapefile for U.S. Counties. I downloaded the zip file and extracted it to a subdirectory in my Documents area.
Get started with QGIS and load that shapefile
Fire up QGIS…the first time it will take a bit to load and then a rather daunting screen pops up:
Add the US County shapefile as a vector layer.
- hit control-shift-v, or
- select the Layer menu | Add Vector Layer
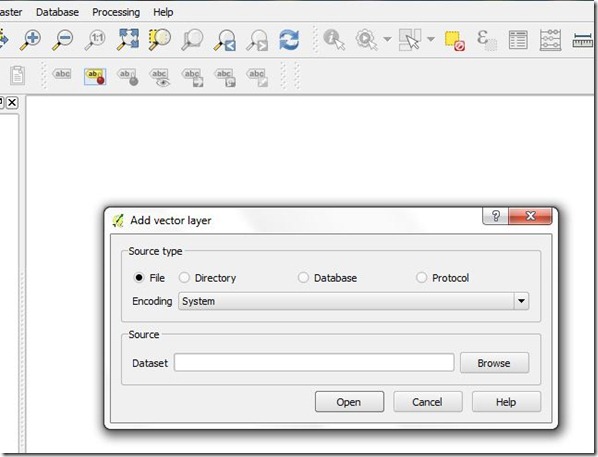
Either way, the following dialog box should pop up:
Using the default settings, Browse and navigate to where you extracted your shapefiles and select, in this case, tl_2013_us_county. If, like me, you like to be able to see file extensions, it will have a .shp ending.
Thanks to a tip from Nathan in the comments, I learned that you do not have to unzip the shapefile. You can also simply drag and drop the entire zip file into the QGIS map canvas. Once done, you can select the tl_2013_us_county.shp vector file and then click OK.
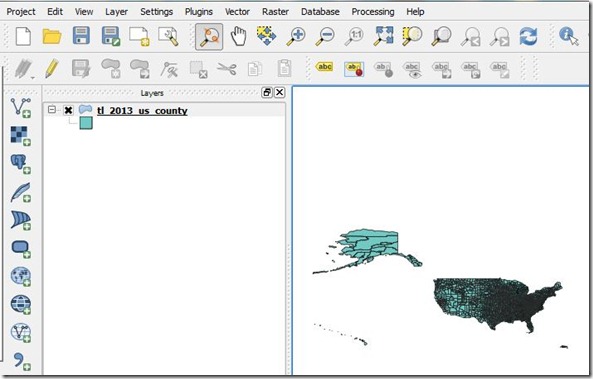
Either way, you should end up with something like this:
If you are curious at this point and want to play around with the file, you can zoom in with the zoom in-out buttons ![]() and the information button
and the information button ![]() to take a look at various counties around the U.S.
to take a look at various counties around the U.S.
However, we need to filter these results down to a manageable chunk.
Filter the shapefile for a particular state
Having the county-level maps for the entire United States is all well and good, but it is a bit…busy.
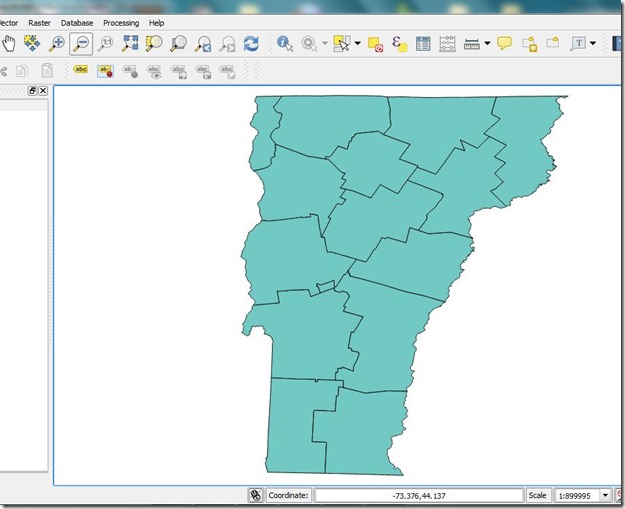
Time to carve out just one state: Vermont.
The Green Mountain State only has 14 counties and this number will make it easier to demonstrate working with county-level data later in the tutorial.
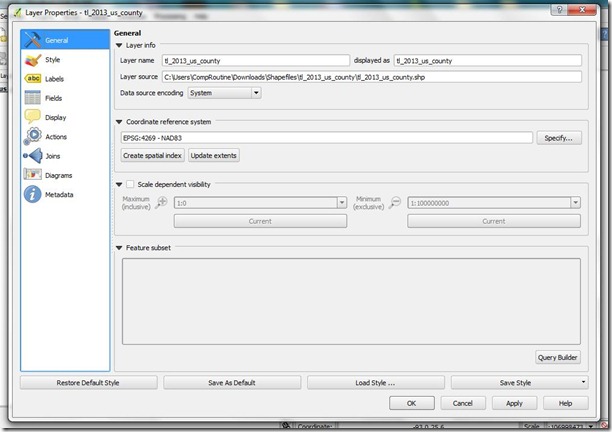
In the Layers pane, on the left-hand side of the main QGIS page, double-click on the shapefile tl_2013_us_county. Be patient, and you will be rewarded with the Layer Property dialog for the shapefile:
A tip if you can’t see all of the QGIS command buttons
I’ve noticed, sometimes, some of the QGIS boxes are too big and the bottom row of buttons cannot be seen. If this happens, use the cursor to grab the top of the box and make it a bit smaller. You should then be able to position the box so that you can see all of the command buttons.
Build that query and filter out Vermont
- be sure General is selected on the left-hand side of the Layer Properties screen
- click on the Query Builder button
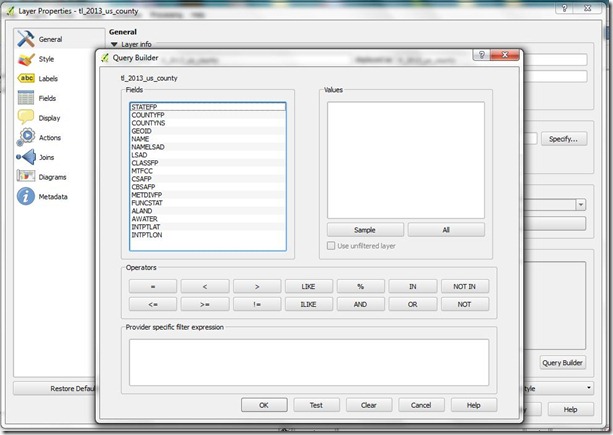
Now, filter for Vermont’s FIPS code, designated by the STATEFP field. A quick Internet search shows that Vermont’s FIPS is 50. So,
- double-click on STATEFP under Fields
- click once on = under Operators
- click once on All under Values
- scroll down to 50 and double-click
- click once on the Test button
and, you should be rewarded with:
- click OK in the Query Result dialog
- click OK in the Query Builders dialog box.
- click Apply in the Layer Properties dialog box
- click OK in the Layer Properties dialog box
Finally, click on the Zoom-Full icon button ![]() and SHAZAM…
and SHAZAM…
Vermont in all her glory:
Save the project by going to Project and Save as. The save routine is pretty much the same as with any Windows software. However, notice that the default directory is buried in the Programs area; so, you might want to navigate to your ‘My Documents’ and create a subdirectory there for QGIS Projects. That way, the project will be easier to find when we come back to start entering data and mapping the results.
Please comment
If you have any problems or know of better ways to accomplish the task shown above, please share in the comments.

